
What you get
Why download it
- Show the full 30 day cycle on one slide.
- Set pace: live in week 1, measure weekly, decide at month end.
- Use in leadership decks and team kick offs.
What the cycle covers
- Day 1 – Start with focus: pick one growth driver and commit for the cycle.
- Week 1 – Set up and run: choose the tool/vendor, launch something live, aim for speed.
- Weeks 2–4 – Measure and adapt: track one metric, log changes, iterate towards a usable result.
- End of Month 1 – Scale or scrap: if it works, standardise and prep to scale; if not, cut and switch driver.
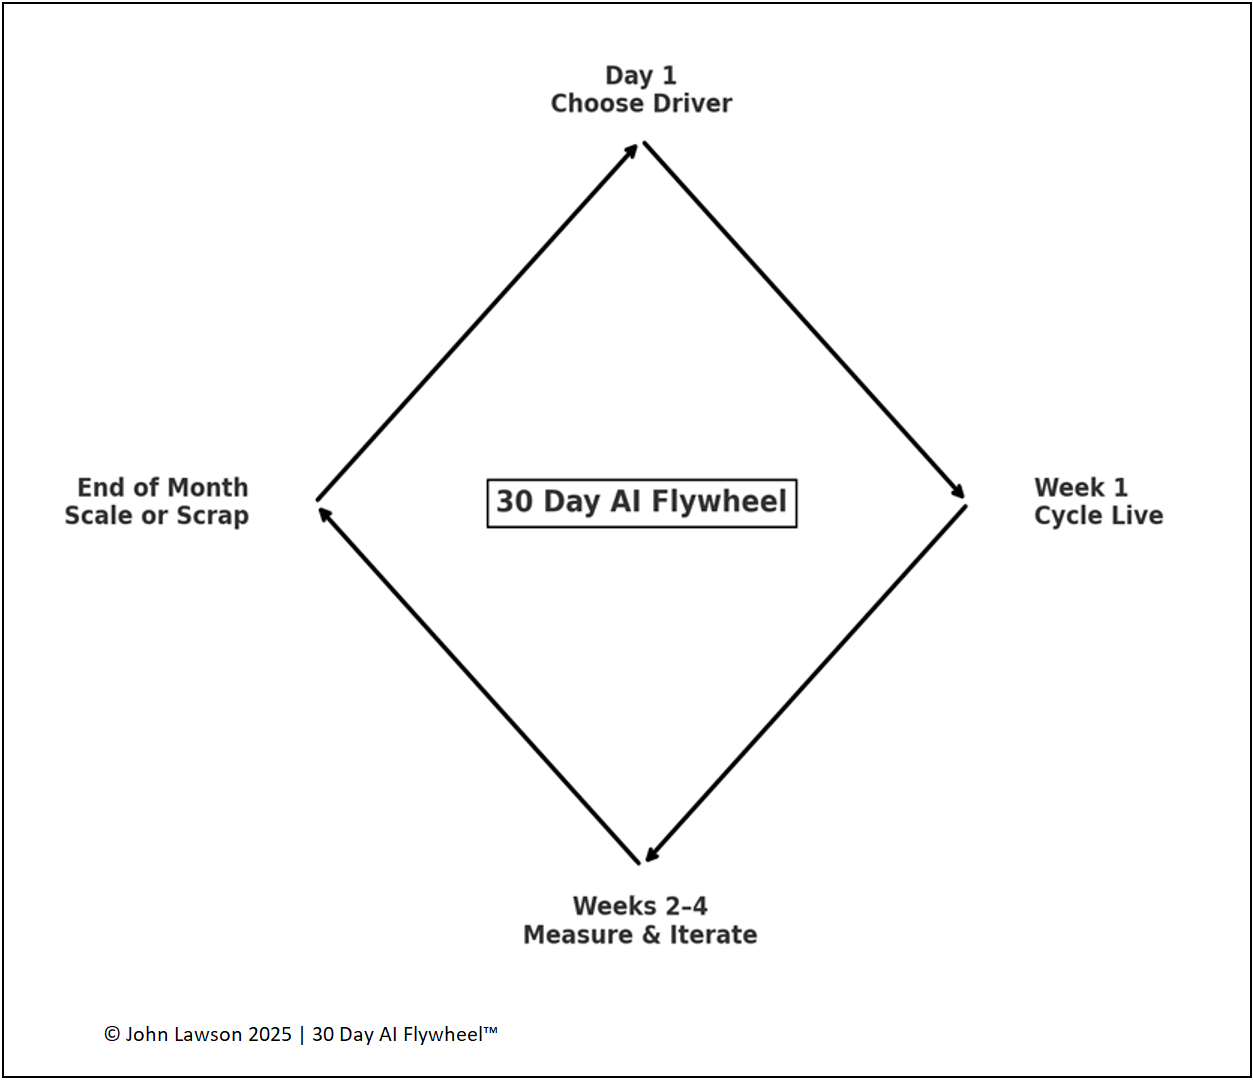
What the diagram shows
- Day 1 (Choose Driver) → Week 1 (Cycle Live) → Weeks 2–4 (Measure & Iterate) → End of Month (Scale or Scrap) → back to Day 1.
Lesson
Repetition builds confidence and speed. Each cycle adds data and adoption. That compounding is where the real edge comes from.

Download the Excel file
File: day1-week1-month1-cycle.xlsx
How to use
- Download the Excel diagram.
- If it opens in your browser, save it:
- Windows: press Ctrl + S or right click and choose Save as.
- Mac: press Cmd + S or control click and choose Save as.
- Drop it into PowerPoint, Keynote, or Google Slides.
- Use it with the Growth Driver Audit and Iteration Log in your next cycle.
Action step
Print or share the diagram. Agree your Day 1 focus, launch in week 1, set one metric, and book the month-end decision now.