
What you get
Why download it
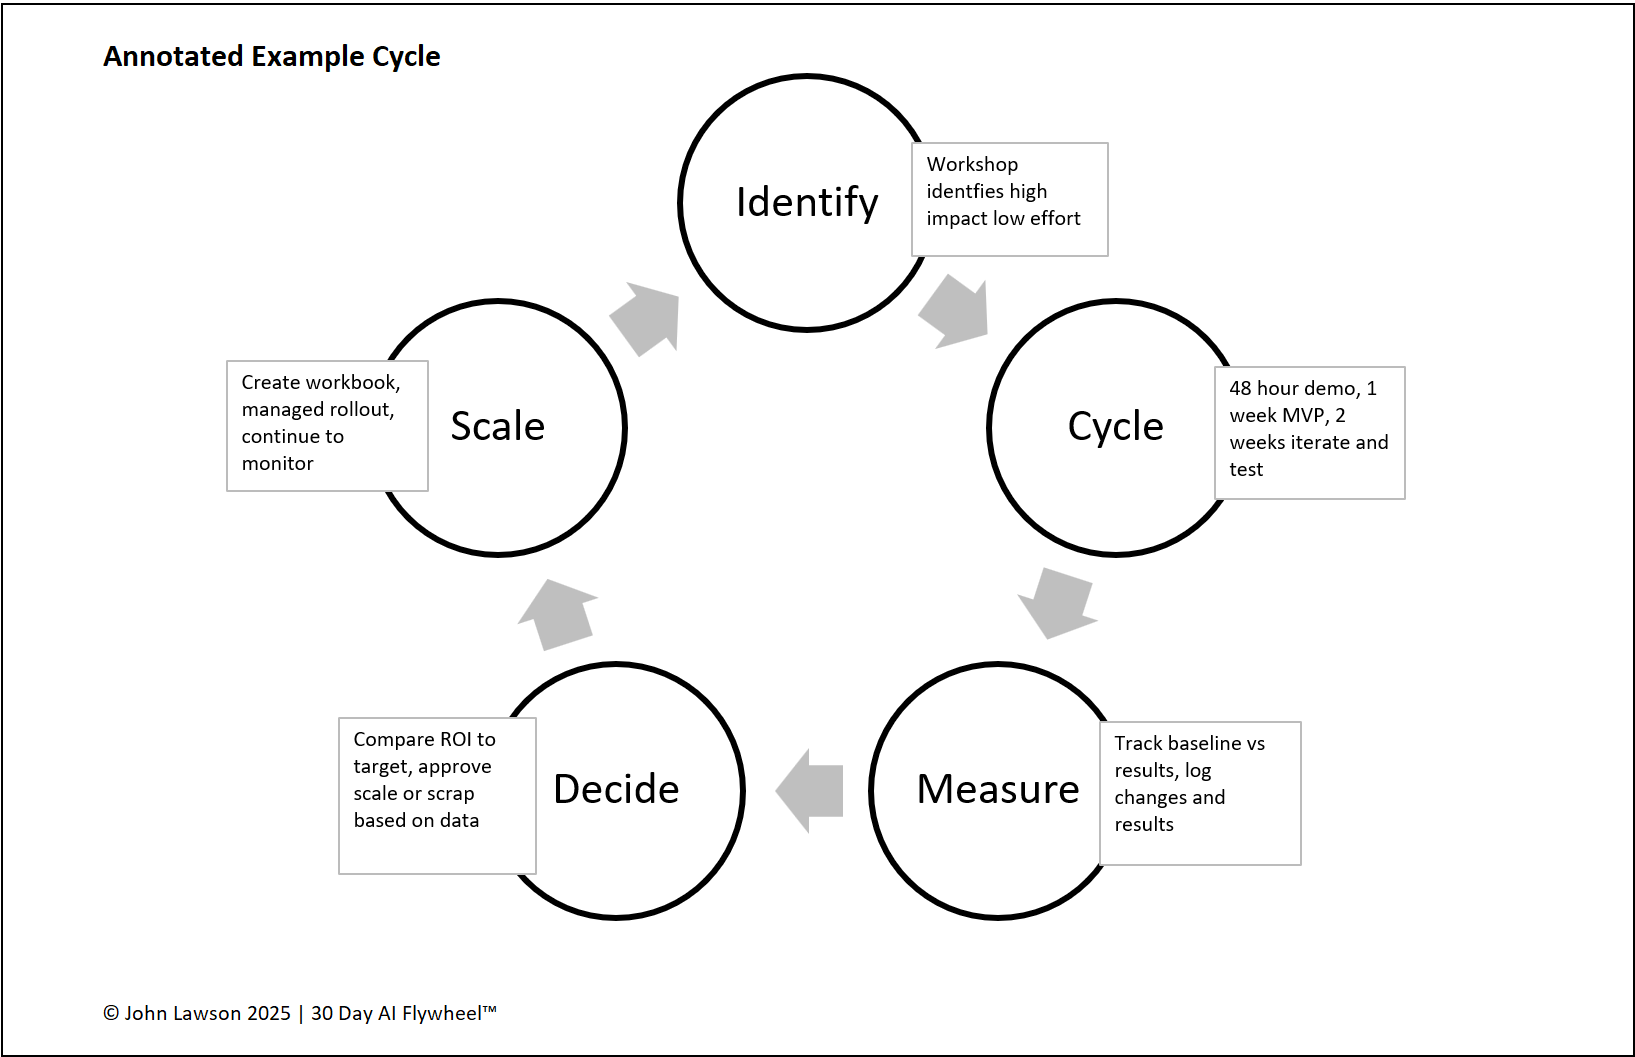
- Show how a real cycle runs end to end.
- Link actions, notes, and outputs so the steps are easy to copy.
- Use as a teaching slide in team sessions.
Identify
- Action: Team workshop picks lead generation as the growth driver.
- Annotation: Growth Driver Audit scores sales leads high impact, low effort.
- Output: Success metric set, e.g. +20% qualified leads.
Cycle
- Action: 48 Hour Demo Sprint with three AI sales assistant tools.
- Annotation: Vendor Evaluation Matrix used to choose one tool.
- Output: Cycle launched with one sales rep for two weeks.
Measure
- Action: Track lead volume and conversion vs baseline.
- Annotation: Iteration Log captures weekly prompt and data tweaks.
- Output: Leads per week rise from 25 to 36.
Decide
- Action: Compare results with the ROI target.
- Annotation: ROI Tracker shows a 40% lift in conversion.
- Output: Leadership agrees to scale.
Scale
- Action: Create the sales team playbook.
- Annotation: Rollout staged across the department over six weeks.
- Output: Process adopted and added to the Portfolio Tracker.
Lesson
Seeing a full cycle annotated makes it practical. Small steps, done in order, build a system that compounds month after month.

Download the Excel file
File: annotated-example-cycle.xlsx
How to use
- Download the Excel diagram.
- If it opens in your browser, save it:
- Windows: press Ctrl + S or right click and choose Save as.
- Mac: press Cmd + S or control click and choose Save as.
- Drop it into PowerPoint, Keynote, or Google Slides.
- Use it alongside the Growth Driver Audit, Iteration Log, ROI Tracker, and Portfolio Tracker.
Action step
Share this slide with your sales lead. Book a 30 minute workshop to pick the driver and start the cycle this week.