What you get
Why it matters
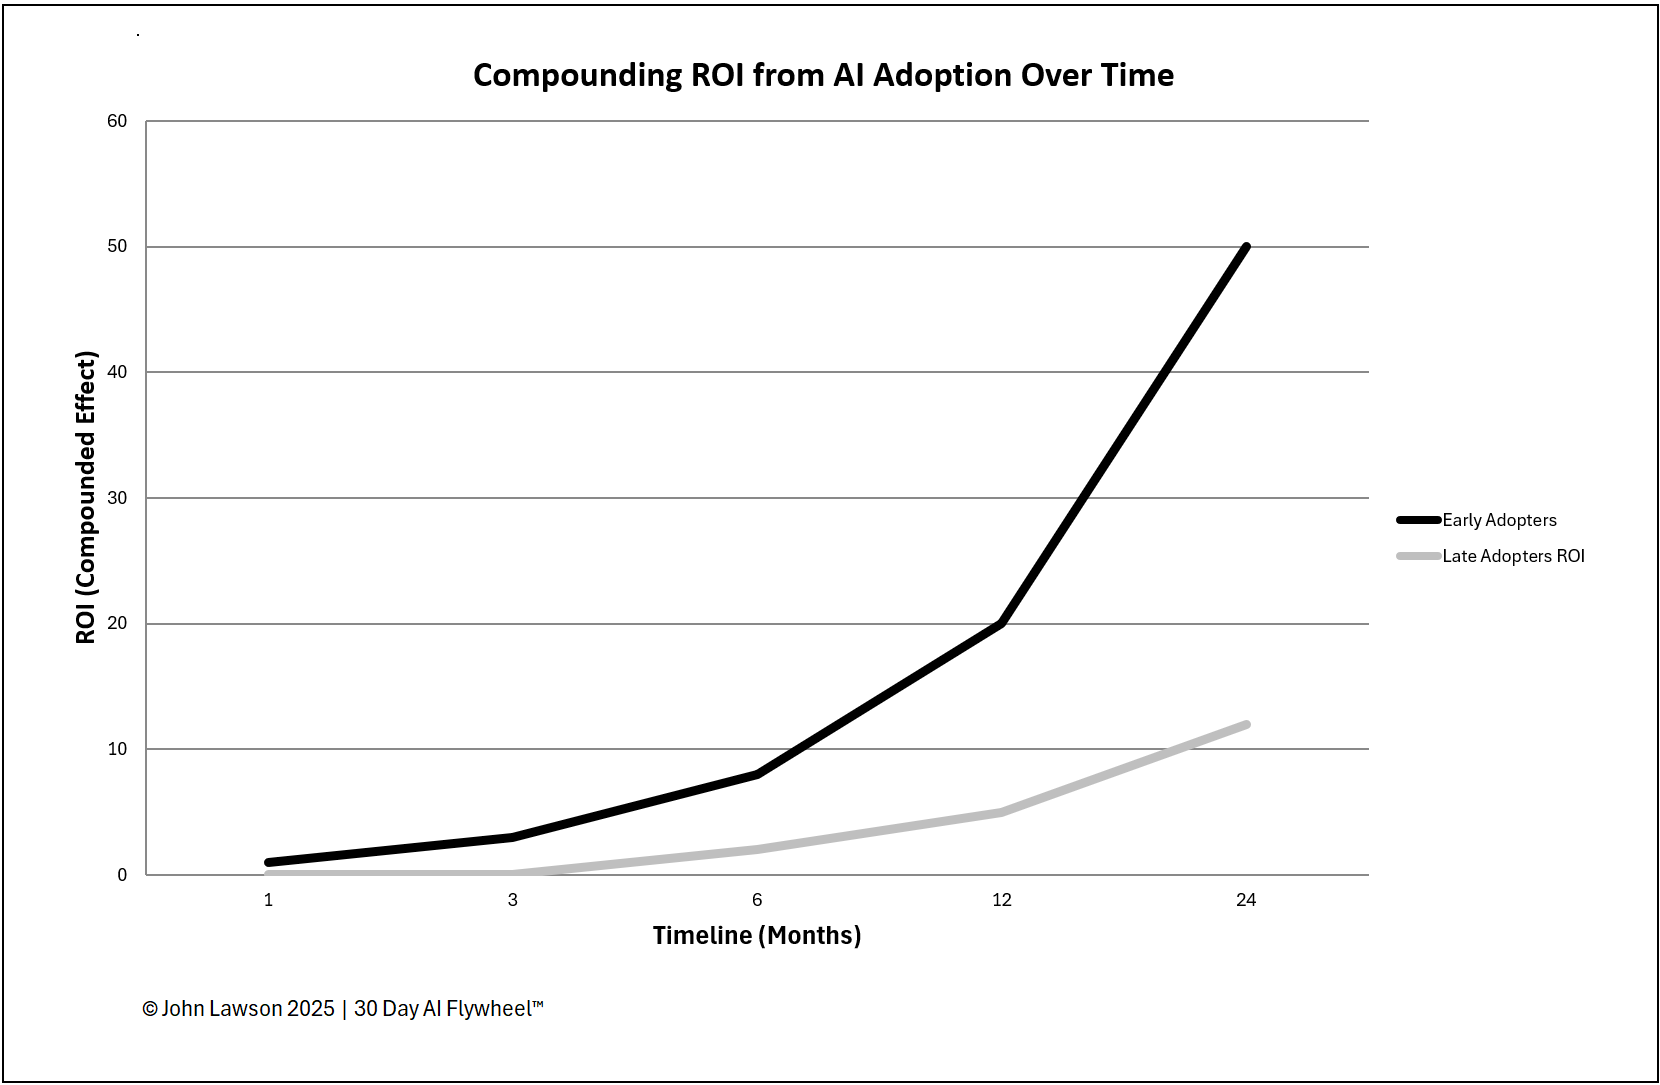
The return on AI adoption compounds over time. Early adopters complete multiple 30-day cycles while late adopters are still evaluating. With every cycle completed, the ROI gap widens — not just in savings and revenue, but in skills, data, and confidence.
How the timeline works
- Month 1–3 — Early adopters run first cycles and prove ROI in small areas; late adopters stay in research mode.
- Month 4–6 — Early adopters scale first wins and launch more cycles; ROI climbs. Late adopters are shortlisting tools.
- Month 7–12 — Early adopters hold several proven use cases; ROI compounds as efficiency and CX gains stack. Late adopters may run their first cycle.
- Year 2 — The gap is clear. Early adopters have lower costs and reset customer expectations; late adopters face a steeper climb against established AI-driven processes.
What the diagram shows
- A rising, steepening curve for early adopters as cycles accumulate.
- A flat line for late adopters through Year 1, followed by a slow rise.
- The widening ROI gap over time.
Lesson
Being early isn’t bragging rights — it’s compounding. Each completed cycle adds knowledge, data, and adoption that you can’t buy later. Waiting doesn’t just slow progress; it risks falling permanently behind.
Inside the file
- ROI Timeline — editable chart with Early vs Late curves and annotated milestones (Months 1–12, Year 2).
- Data Table — month-by-month inputs for ROI % (or value), cycle count, and notes.
- Assumptions — tweak improvement per cycle and scaling factors to fit your context.
- Poster — clean one-pager for leadership meetings.

Download the Excel file
File: early-vs-late-roi.xlsx
How to use
- Download the diagram.
- If it opens in your browser, save it:
- Windows: press Ctrl + S or right-click & choose Save as.
- Mac: press Cmd + S or control-click & choose Save as.
- Adjust assumptions and enter monthly ROI or value data for your programme.
- Use the Poster view in leadership meetings to make the cost of waiting visible.
Action step
Print or share the diagram and use it in leadership meetings to show how ROI compounds for early adopters — and why delay widens the gap.