What you get
Why download it
- Set expectations: narrowing is progress, not failure.
- Align stakeholders on the path from ideas to decisions.
- Track where opportunities sit today across the funnel.
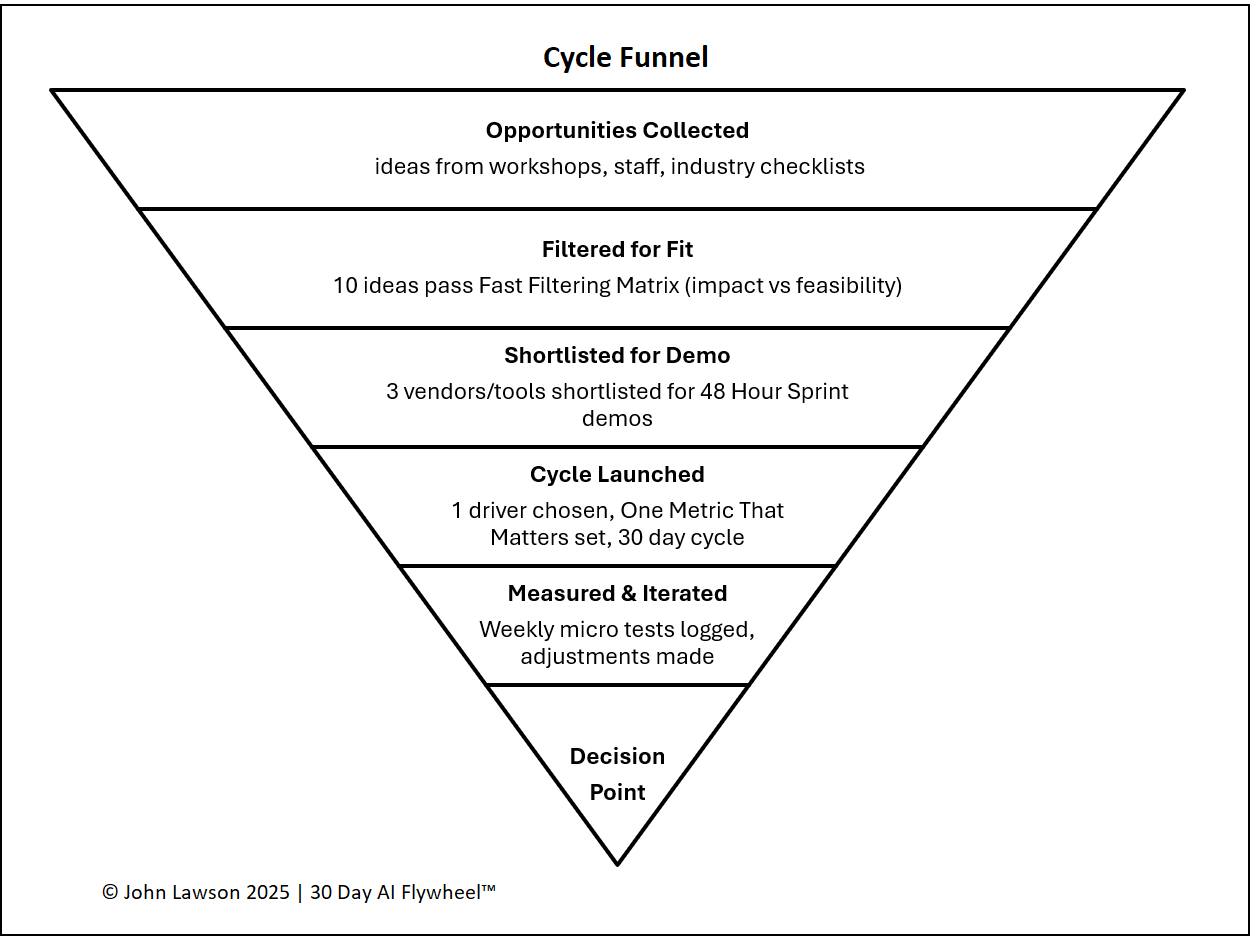
Stages of the funnel
- Opportunities Collected — ideas from workshops, staff input, and industry lists; dozens possible.
- Filtered for Fit — apply the Fast Filtering Matrix (impact × feasibility); keep Quick Wins and a few Strategic Bets.
- Shortlisted for Demo — 3–5 vendors/tools chosen after sanity checks; demos run in a 48-Hour Sprint.
- Cycle Launched — one driver selected; clear One Metric That Matters; 30-day cycle begins.
- Measured & Iterated — weekly micro-tests logged; adjustments made to optimise results.
- Decision Point — apply Kill Criteria; scale, scrap, or re-run with changes.
What the diagram shows
- A six-layer funnel, widest at the top and narrowing to the decision.
- Stage labels and short descriptions (Collect → Filter → Shortlist → Cycle → Measure → Decide).
- Optional count fields to show how many items sit in each layer.
Inside the file
- Funnel sheet — editable six-stage diagram with counts.
- Stages & Notes — guidance text and space for team annotations.
- Poster — clean one-pager for decks and workshop printouts.
Why it matters
The funnel reminds teams that rejection is part of the process. You don’t need every idea to work — just a few proven use cases to build momentum.

Download the Excel file
File: cycle-funnel.xlsx
How to use
- Download the diagram.
- If it opens in your browser, save it:
- Windows: press Ctrl + S or right-click & choose Save as.
- Mac: press Cmd + S or control-click & choose Save as.
- With your team, add current counts per stage and update weekly.
- Use it to communicate progress: moving down the funnel is success.
Action step
Share the Cycle Funnel diagram with the team. Use it to remind everyone that narrowing down is progress — and pick the next cycle with confidence.