What you get
Why download it
- Show how results speed up with each 30 day cycle.
- Explain compounding ROI without jargon.
- Use a simple visual for leadership and teams.
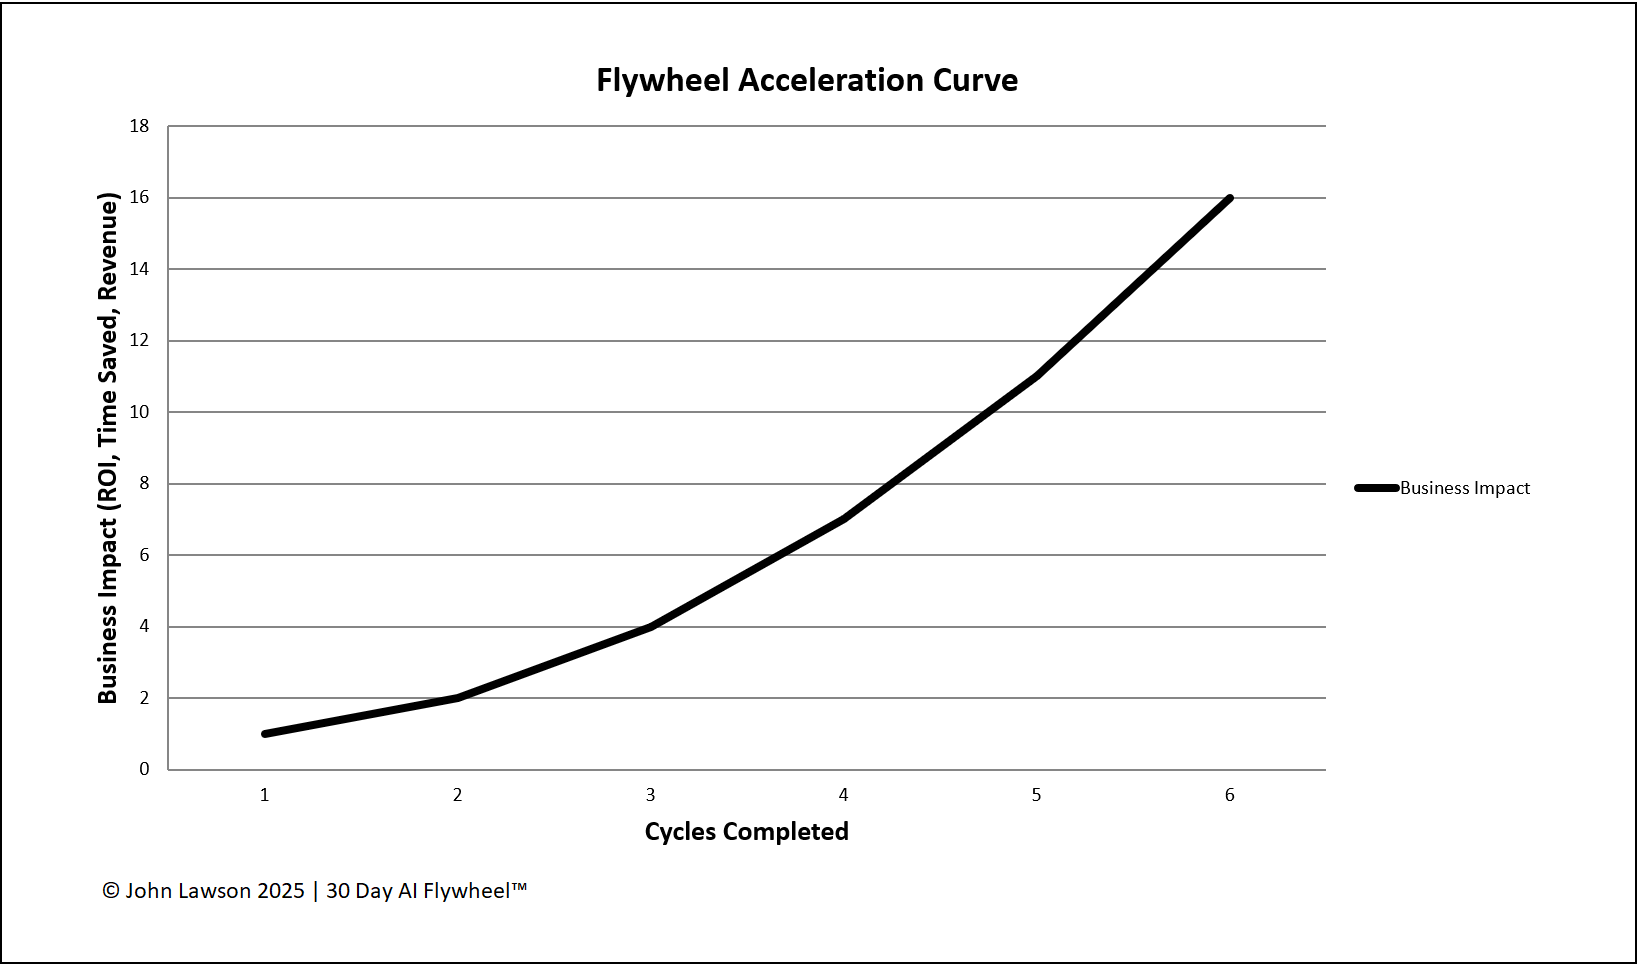
How the curve works
- Cycle 1: Effort is high and results are small. Teams are learning and value must be proven.
- Cycle 2–3: Less effort is needed. Templates, metrics, and habits are in place. Each cycle delivers faster results.
- Cycle 4+: Adoption spreads. Champions drive consistency. Wins stack into a steeper ROI curve.
What the diagram shows
- X-axis: time, measured in cycles completed.
- Y-axis: business impact, such as ROI, time saved, or revenue gained.
- A shallow start that rises more steeply as cycles add up.
Lesson
Speed matters because returns compound. Repeat the cycle and the advantage grows. If you wait, you face a steeper catch up later.

Download the Excel file
File: flywheel-acceleration-curve.xlsx
How to download
- Click the button above. The file will start to download.
- If it opens in your browser, save it to your computer:
- Windows: press Ctrl + S or right click and choose Save as.
- Mac: press Cmd + S or control click and choose Save as.
- Open the file in Microsoft Excel or Google Sheets.
- If using Google Sheets, make a copy before editing.
Quick start
- List your current and planned cycles in the Cycles tab.
- Record time, effort, and outcomes for each cycle in Runs.
- Use the Curve tab to see how impact steepens as cycles repeat.
- Add this chart to your next leadership pack to set pace expectations.