
What you get
Why download it
- Make the case for cycles over long plans in one slide.
- Reduce risk by proving value earlier.
- Use a clear visual in leadership decks and workshops.
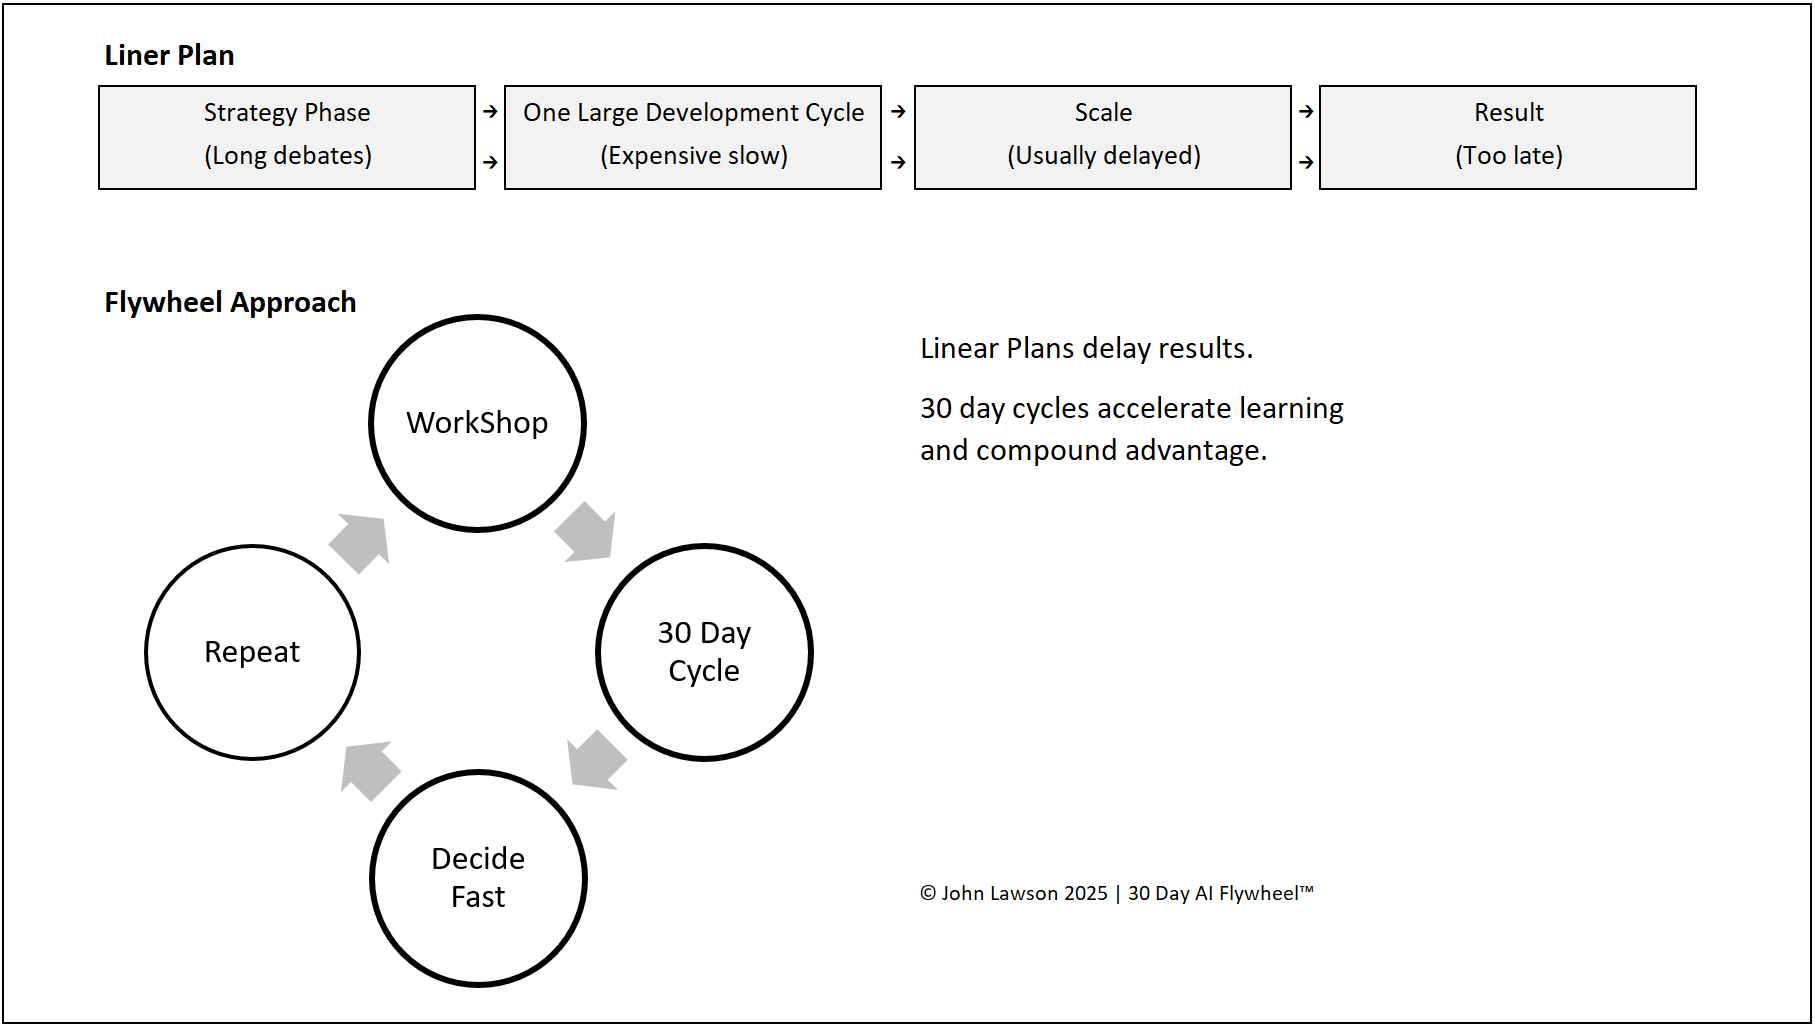
Linear plan
- Step 1: Long strategy phase, endless debates and vendor comparisons.
- Step 2: One large cycle, expensive, high risk, slow to adjust.
- Step 3: Scale delayed or blocked because the cycle was too big.
- Result: When results arrive, the market has moved on.
Flywheel approach
- Step 1: Short workshop, pick one growth driver fast.
- Step 2: 30-day cycle, small, low-cost, easy to measure.
- Step 3: Decide fast — scale if it works, scrap if it doesn’t.
- Step 4: Repeat. Each cycle builds confidence, skills, and ROI.
Outcome: Compounding gains with less risk and faster proof.
What the diagram shows
- Top: a flat row of boxes — strategy → develop → scale → result.
- Bottom: a circular pattern — multiple Flywheel cycles in the same time, with impact rising after each cycle.
Lesson
Linear plans delay results. The Flywheel accelerates learning and compounds advantage. Teams that switch to 30-day cycles move faster and are harder to catch.

Download the Excel file
File: flywheel-vs-linear.xlsx
How to use
- Download the Excel diagram.
- If it opens in your browser, save it:
- Windows: press Ctrl + S or right click and choose Save as.
- Mac: press Cmd + S or control click and choose Save as.
- Drop it into PowerPoint, Keynote, or Google Slides.
- Use it to explain why you’re switching from long plans to 30-day Flywheel cycles.
Action step
Open your next planning session with this slide. Pick one growth driver, run a 30-day cycle, and book the scale/scrap decision now.