What you get
Why it matters
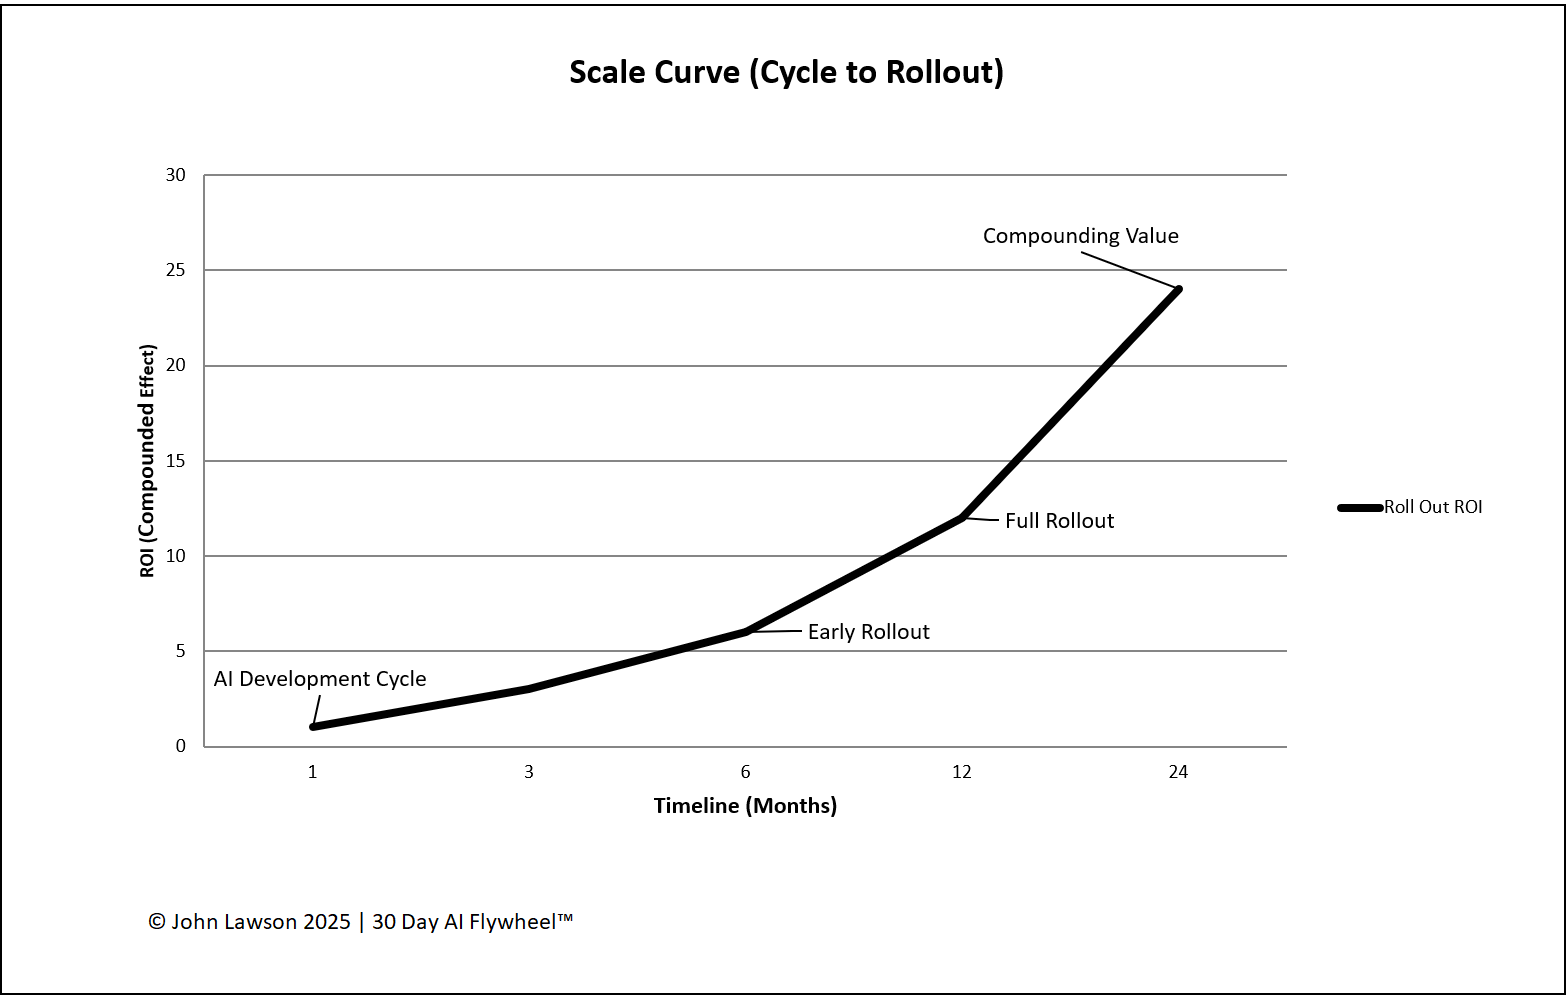
When a project succeeds, the goal isn’t to celebrate and move on — it’s to scale the process. The Scale Curve makes clear that ROI grows with adoption: cycles prove value; rollouts multiply it.
Stages on the curve
- Cycle (0–30 days) — small test group, limited scope, low risk. Goal: prove the One Metric That Matters.
- Early Rollout (1–3 months) — expand to a second team/product/region; create a Training Playbook. Goal: confirm results at broader use.
- Full Rollout (3–12 months) — extend to all relevant teams/markets; integrate with core systems (CRM/ERP/analytics). Goal: make it business as usual.
- Compounding Value (12+ months) — multiple scaled use cases running; ROI reinvested into more cycles. Goal: flywheel effect.
What the diagram shows
- A rising curve from left (Cycle) to right (Compounding Value).
- X-axis: Time (days → months → year). Y-axis: Value created (ROI, time saved, revenue).
- Four labelled points: AI Development Cycle, Early Rollout, Full Rollout, Compounding Value.
- Curve steepens after Early Rollout to show faster value growth as adoption spreads.
Inside the file
- Scale Curve — editable chart with stage markers and annotations.
- Stages — fields for dates, scope, owners, dependencies, and risks.
- Adoption Tracker — % users enabled and trained per team/region.
- ROI Summary — per-stage signals (revenue, savings, time) that roll up.
- Poster — clean one-pager for leadership decks.
Example
A logistics company piloted AI demand forecasting on one product line (−12% stockouts in 30 days). After rollout across five lines, savings hit seven figures. By year-end, forecasting became the standard — and the gains funded three new AI projects.

Download the Excel file
File: scale-curve.xlsx
How to use
- Download the diagram.
- If it opens in your browser, save it:
- Windows: press Ctrl + S or right-click & choose Save as.
- Mac: press Cmd + S or control-click & choose Save as.
- Enter stage dates, scope, and owners; adjust the curve notes to match your rollout plan.
- Update the Adoption Tracker weekly and use the Poster view in leadership meetings.
Action step
Use the Scale Curve in planning meetings to set expectations: the full value is unlocked only after rollout — cycles prove, rollouts multiply.